
MoSKito Art
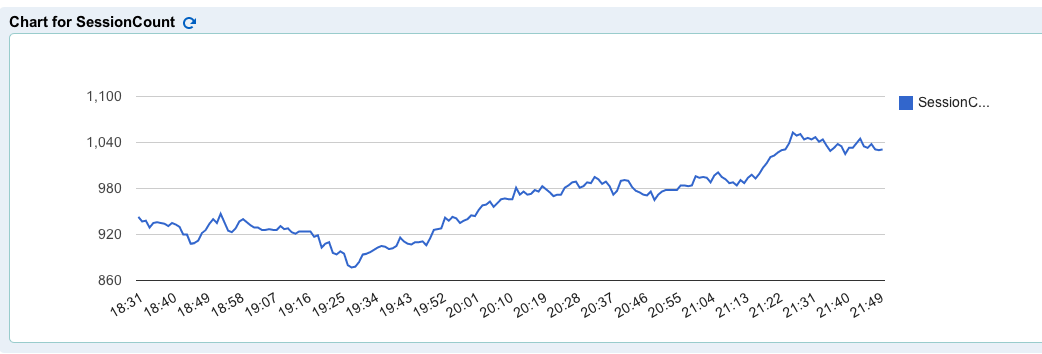
MoSKito can produce graphs. Some looks quite normal like the both graphs below, representing a normal day session count development:
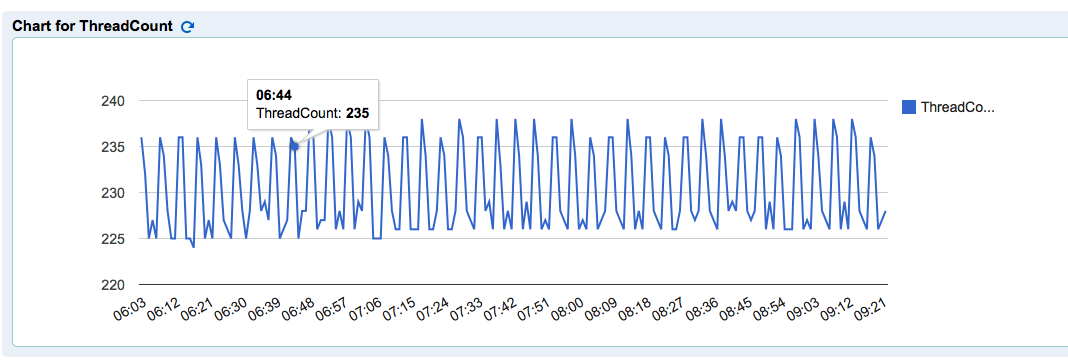
or the thread count in a more or less regular app:
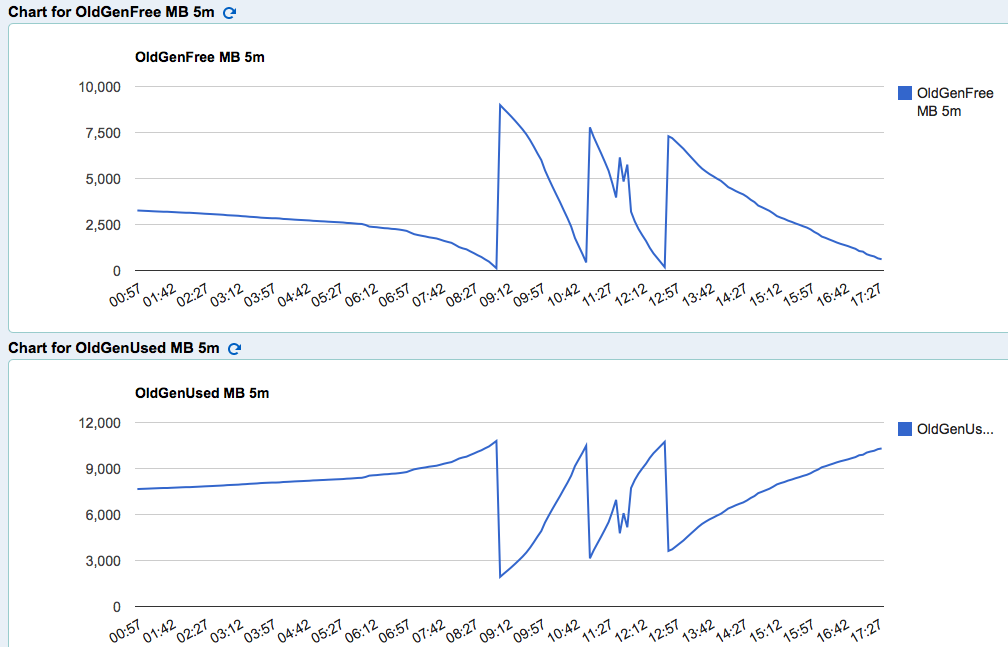
Others look like art. Here are some examples.
A christmas tree.
A fallen one 🙂
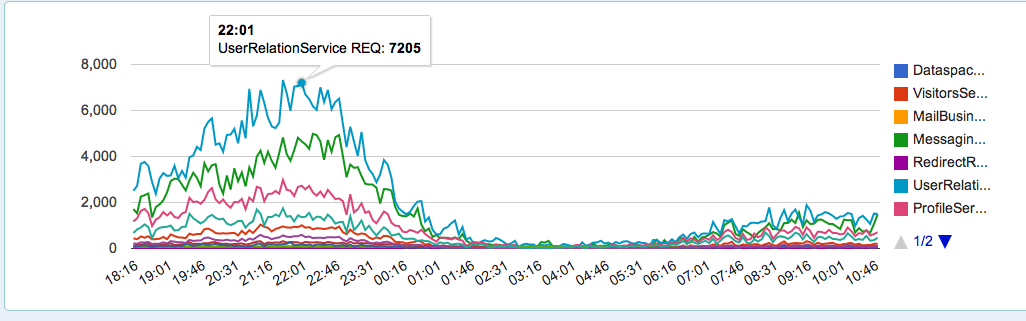
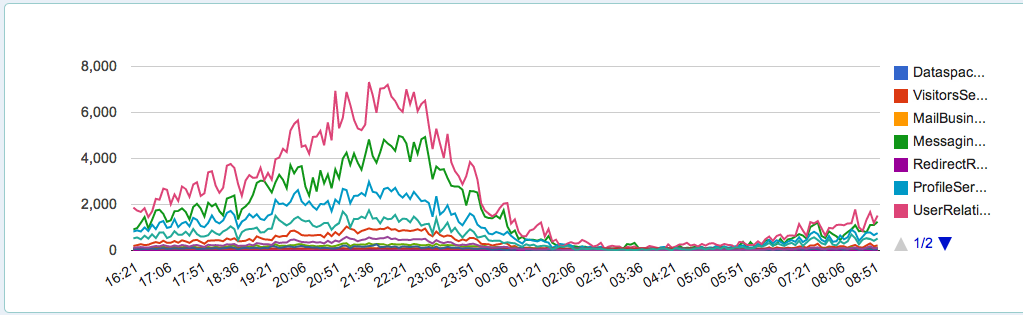
This is a rather busy evening.
Normalization can do funny things to a value:
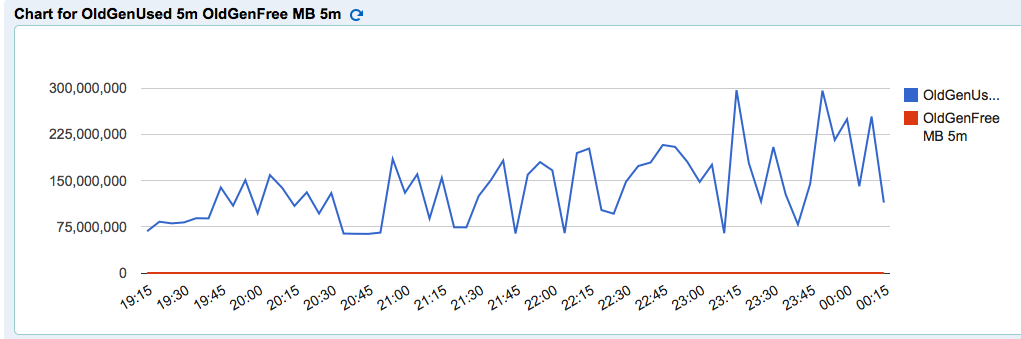
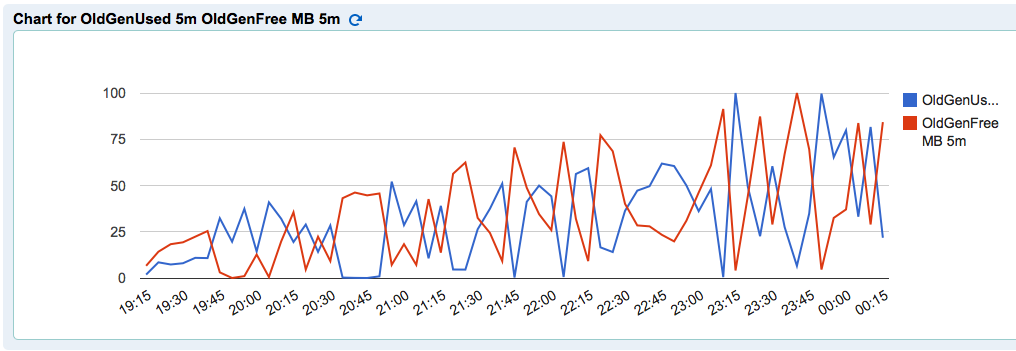
Information overkill:
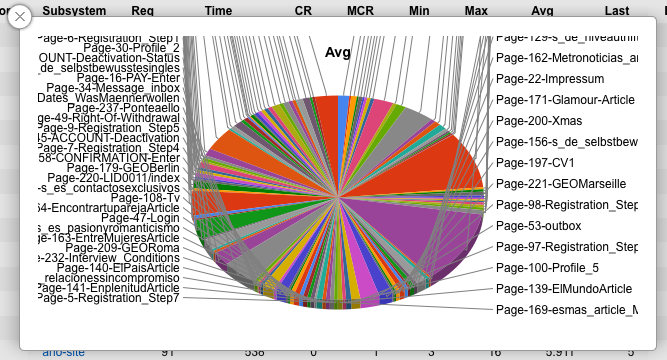
This if one of my favorites, it’s called “Big Surprise“:
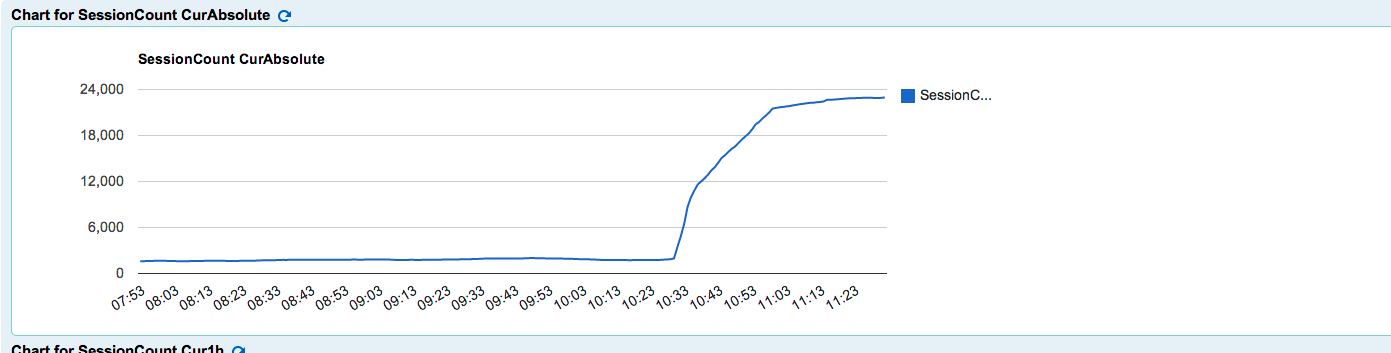
Well maybe not exactly art, but some pictures are really funny. More to follow.
Enjoy.
Leon
Jumpstart MoSKito
MoSKito is a devops tool to manage and understand your application at runtime. With this post we will describe how to jumpstart MoSKito by using MoSKito Minimal sample application...
September news
This is a short overview of topics in opensource that took place in september. MoSKito MoSKito got 2 updates in September, 1.5.0 and 1.6.0. The later got autoreload functionality...